
EVIDENCE OVER INSTINCTGive your ideas
Give your ideas
something to stand on.
Explore patterns, compare outcomes, and question assumptions. Let the data inform your perspective.
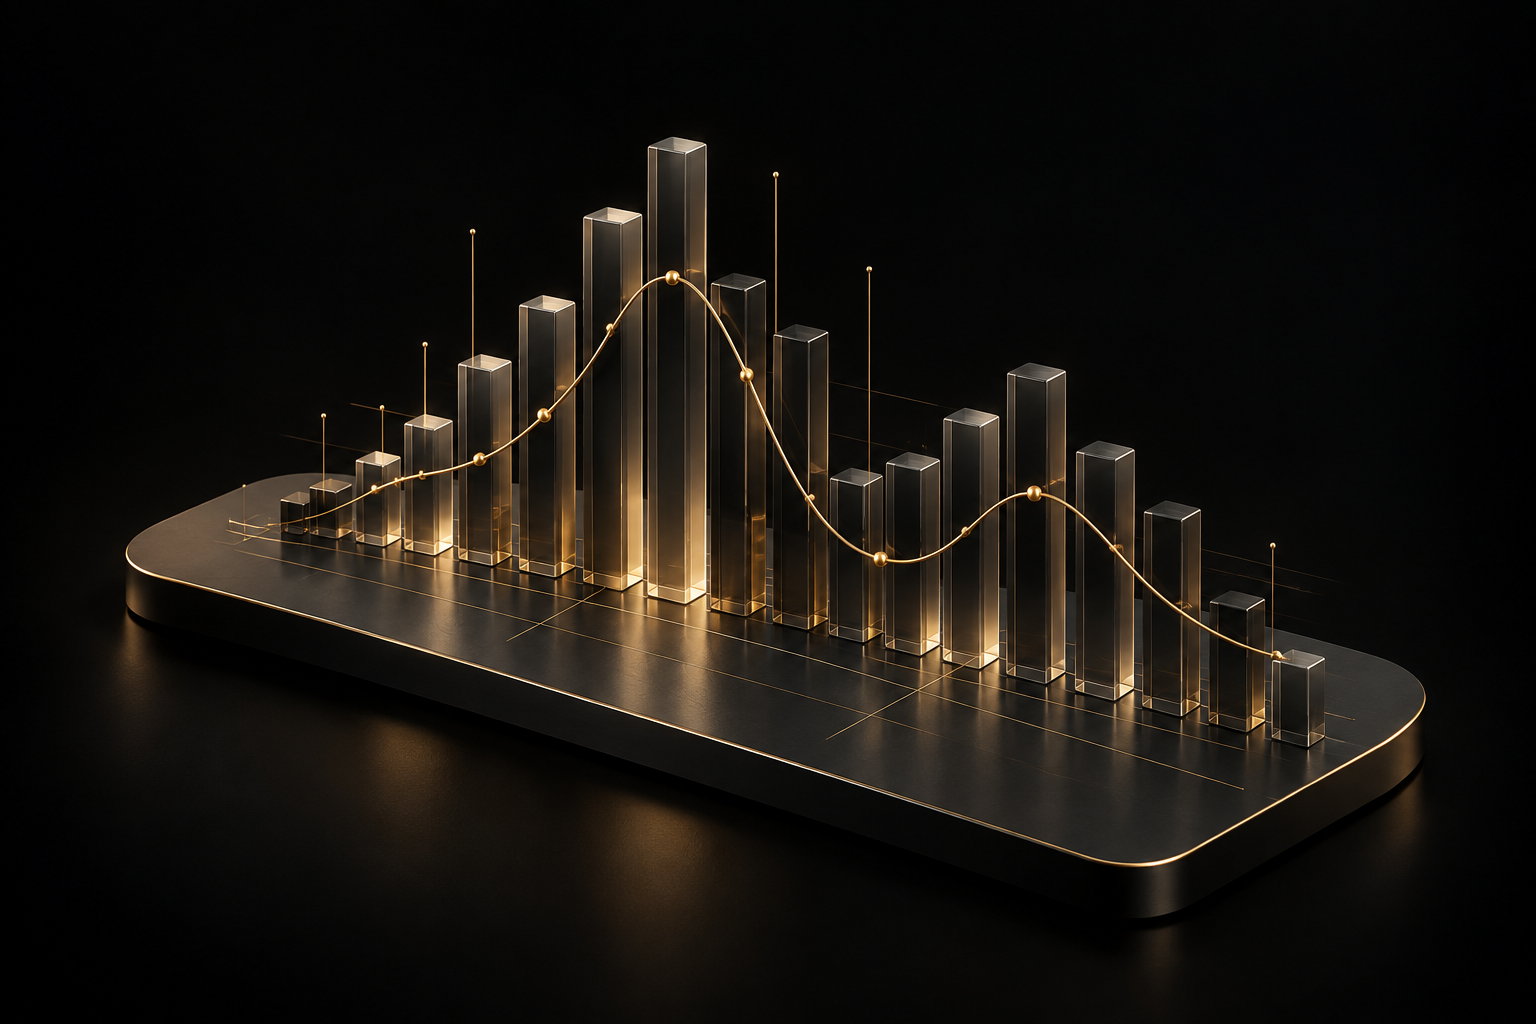
INTELLIGENCE IN MOTION
Market insights, strategy testing, and trading signals. One considered view for your next move.
Illustrative
app snapshot
Turn scattered information into context.
Explore the rules behind an idea.
Keep risk in the conversation.
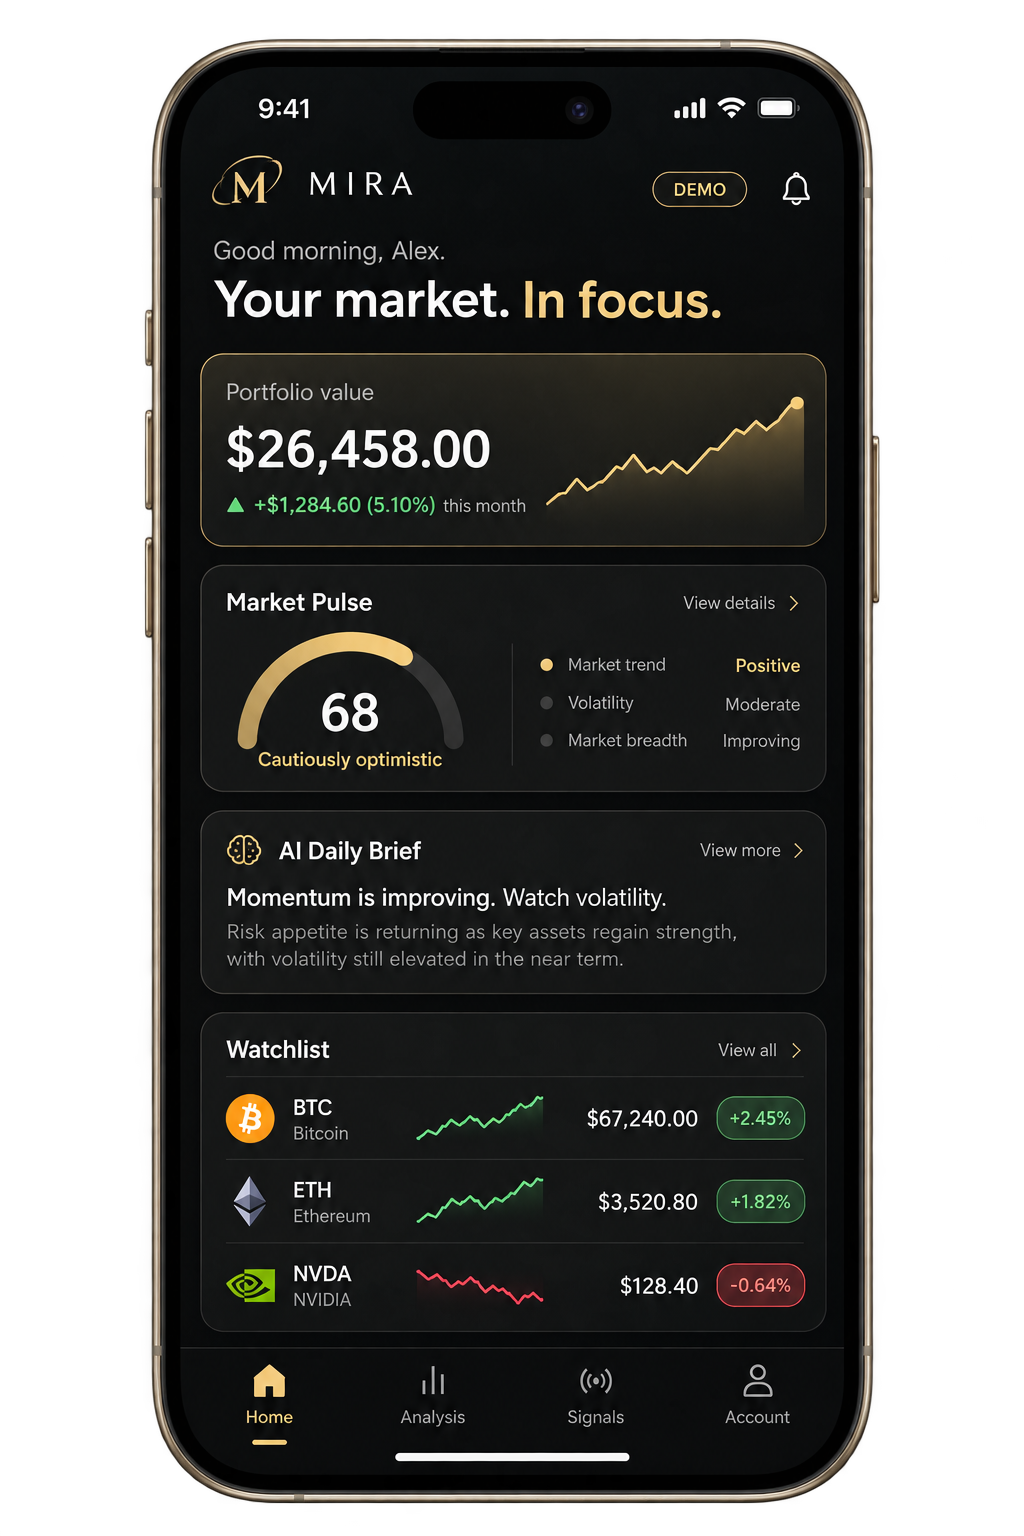
01 / MARKET OVERVIEW
A market view that connects the dots. Bring your portfolio, market mood, and daily context together — before you decide what comes next.
Cautiously optimistic.
A little context goes a long way.
A clearer starting point.
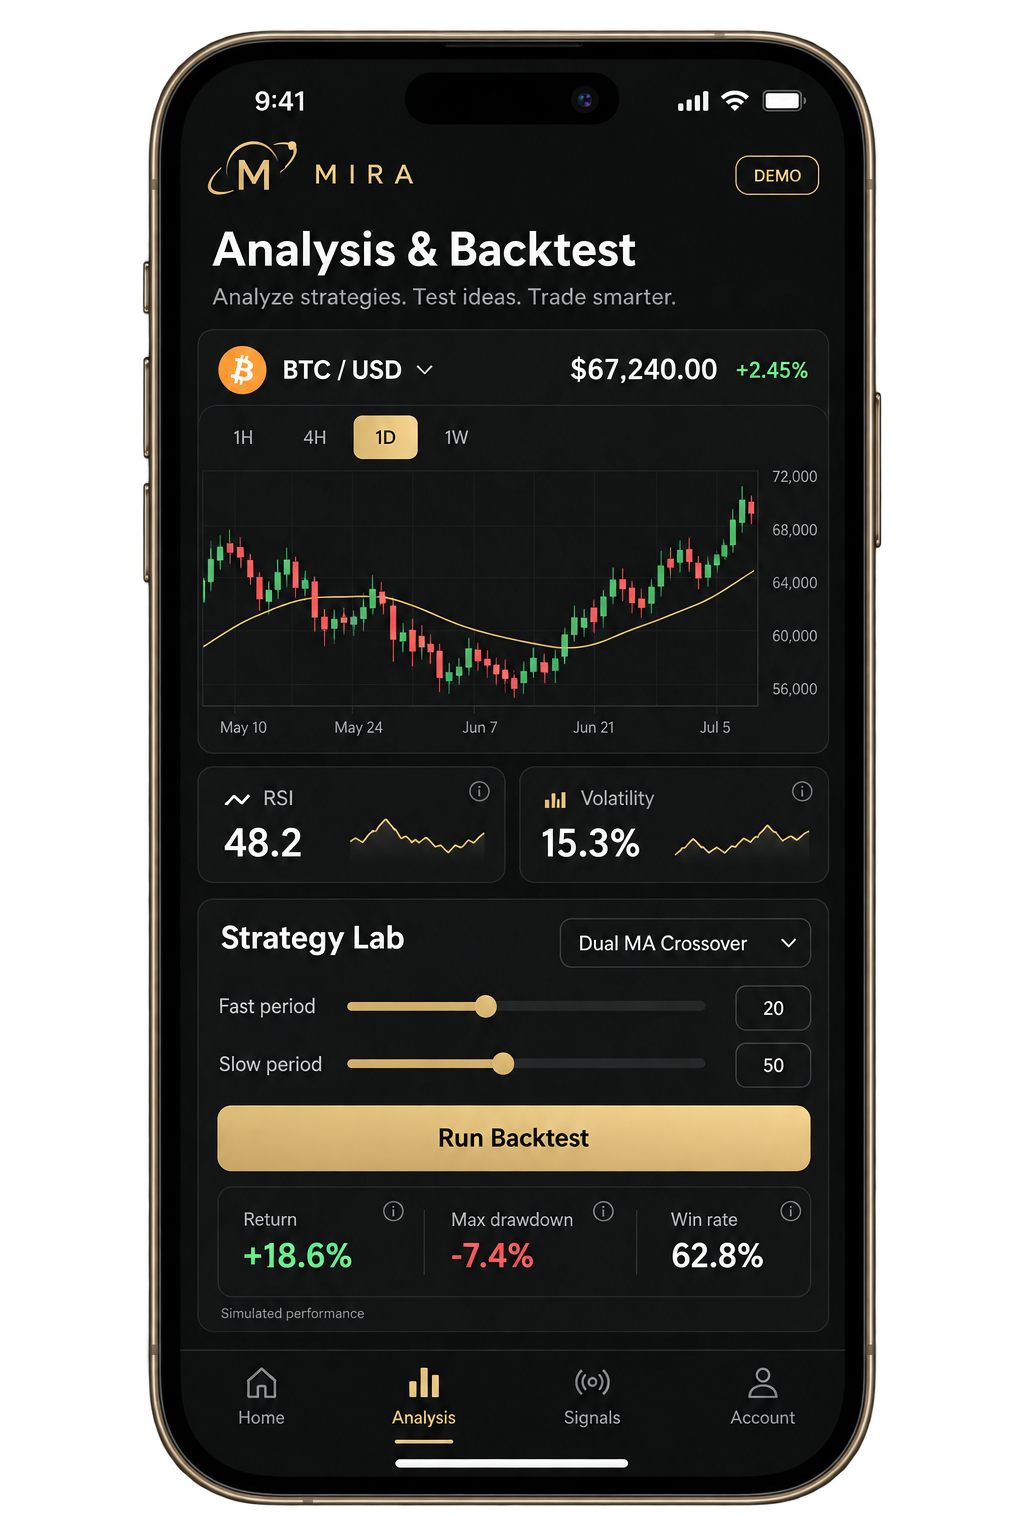
02 / STRATEGY LAB
Put an idea through its paces. Explore price action, adjust the parameters, and understand the trade-offs behind a result.
Price charts and technical indicators, in one focused workspace.
Tune strategy parameters before running a historical simulation.
Consider returns alongside drawdown and win rate.
Backtests are simulations. Historical results do not predict future performance.
A MORE CONSIDERED APPROACH
Markets change. A thoughtful approach
gives you something to come back to.
Explore patterns, compare outcomes, and question assumptions. Let the data inform your perspective.
Keep exposure, drawdown, and risk limits visible. A considered decision looks in both directions.

03 / SIGNAL INTELLIGENCE
Direction is only the beginning. Read signal strength, entry references, and risk levels together, with the context to look closer.
Illustrative signal. A starting point for analysis.
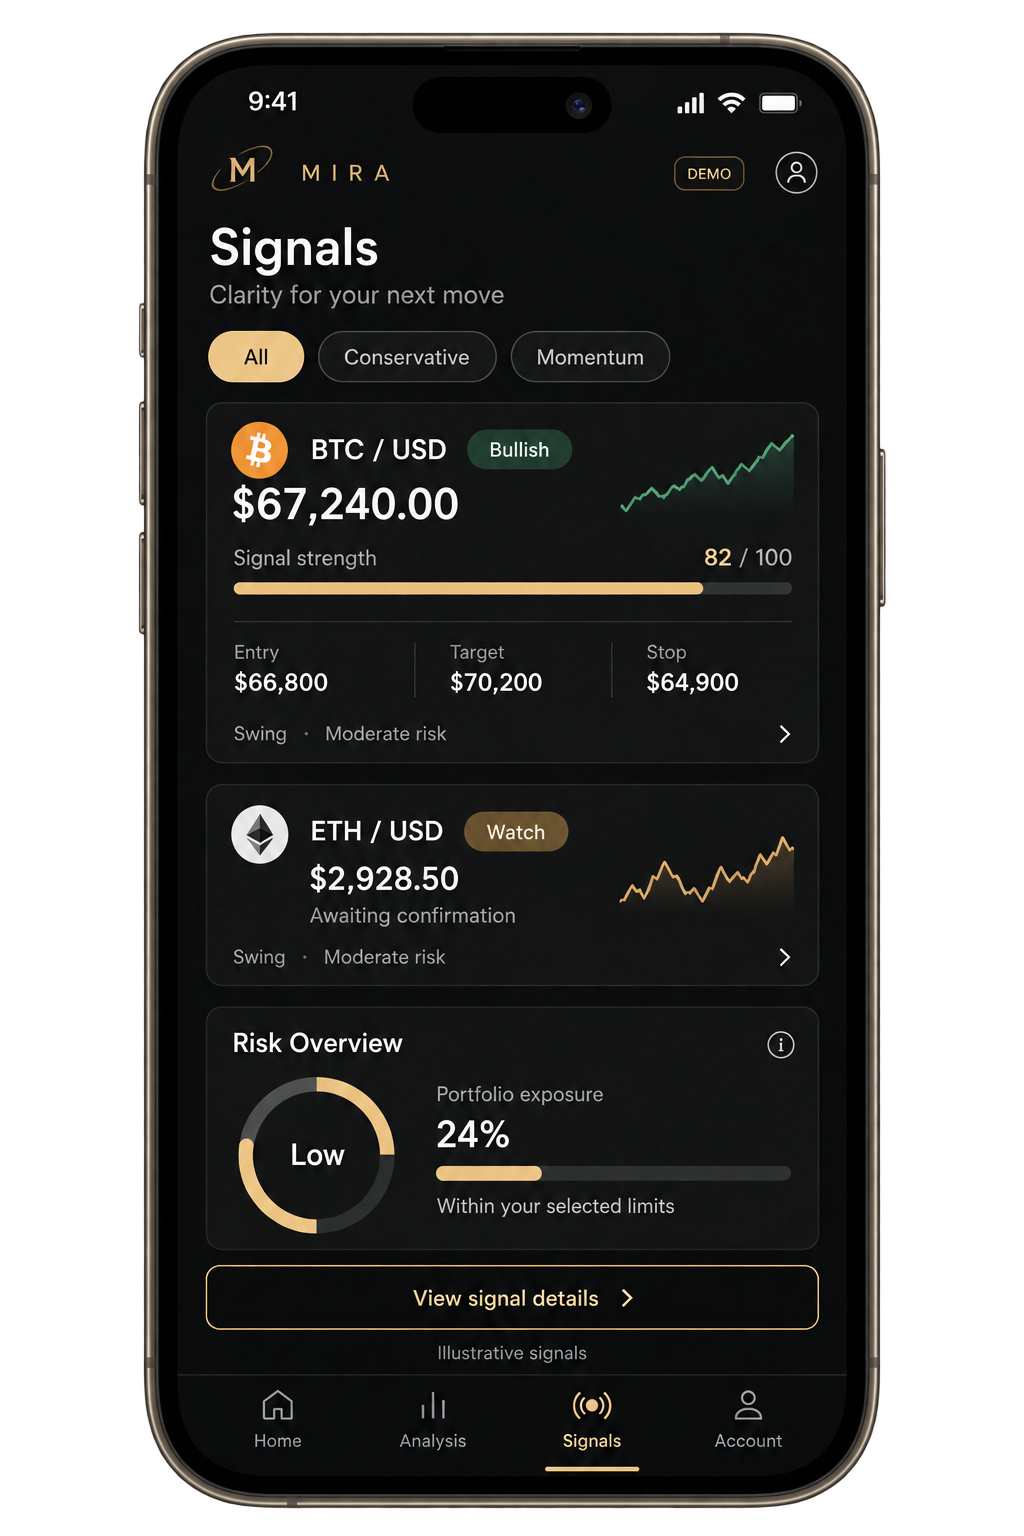
Context before action.
YOUR DAILY RHYTHM
Check the market pulse.
Find what deserves your attention.
Put a strategy to the test.
Understand the trade-offs.
Read the signal in context.
Bring risk into the picture.
A LITTLE MORE CLARITY
Get to know the thinking
behind MIRA.
MIRA is an AI trading system concept that brings market overviews, technical analysis, strategy backtesting, and contextual trading signals into one focused interface.
The concept includes candlestick charts, technical indicators, adjustable moving-average parameters, and historical backtest results. Returns, drawdown, and win rate are presented together.
A backtest simulates how selected rules would have behaved over historical data. Its results depend on the data and assumptions used. Simulated performance does not predict future outcomes.
This experimental experience uses illustrative balances, prices, and signals to demonstrate the product design. The app-store buttons are concept placeholders.
YOUR NEXT PERSPECTIVE
Bring the market into focus with MIRA.
A product concept. A new perspective.